Key details for this exam, checked against the published exam outline
Each question shows the correct answer and an explanation of why it is right
SIMULATION
Task 12
An issue with the Tampa web servers has been reported. You would like to replicate and redirect the web traffic to a network monitoring tool outside Of the NSX-T environment to further analyze the traffic.
You are asked to configure traffic replication to the monitoring software for your Tampa web overlay segments with bi-directional traffic using this detail:

Complete the requested configuration.
Notes: Passwords are contained in the user_readme.txt. This task is not dependent on other tasks. This task should take approximately 10 minutes to complete.
To configure traffic replication to the monitoring software for your Tampa web overlay segments with bi-directional traffic, you need to follow these steps:
Log in to the NSX Manager UI with admin credentials. The default URL is https://<nsx-manager-ip-address>.
Navigate to Networking > Segments and select the Tampa web overlay segment that you want to replicate the traffic from. For example, select Web-01 segment that you created in Task 2.
Click Port Mirroring > Set > Add Session and enter a name and an optional description for the port mirroring session. For example, enter Tampa-Web-Monitoring.
In the Direction section, select Bi-directional as the direction from the drop-down menu. This will replicate both ingress and egress traffic from the source to the destination.
In the Source section, click Set and select the VMs or logical ports that you want to use as the source of the traffic. For example, select Web-VM-01 and Web-VM-02 as the source VMs. Click Apply.
In the Destination section, click Set and select Remote L3 SPAN as the destination type from the drop-down menu. This will allow you to replicate the traffic to a remote destination outside of the NSX-T environment.
Enter the IP address of the destination device where you have installed the network monitoring software, such as 10.10.10.200.
Select an existing service profile from the drop-down menu or create a new one by clicking New Service Profile. A service profile defines the encapsulation type and other parameters for the replicated traffic.
Optionally, you can configure advanced settings such as TCP/IP stack, snap length, etc., for the port mirroring session.
Click Save and then Close to create the port mirroring session.
SIMULATION
Task 16
You are working to automate your NSX-T deployment and an automation engineer would like to retrieve your BOP routing information from the API.
You need to:
* Run the GET call in the API using Postman
* Save output to the desktop to a text file called API.txt
Complete the requested task.
Notes: Passwords are contained in the user _ readme.txt. This task is not dependent on another. This task should take approximately 5 minutes to complete.
To run the GET call in the API using Postman and save the output to the desktop to a text file called API.txt, you need to follow these steps:
Open Postman and create a new request tab. Select GET as the method from the drop-down menu.
Enter the URL of the NSX-T Policy API endpoint for retrieving the BGP routing table, such as https://<nsx-manager-ip-address>/policy/api/v1/infra/tier-0s/vmc/routing-table?enforcement_point_path=/infra/sites/default/enforcement-points/vmc-enforcementpoint
Click the Authorization tab and select Basic Auth as the type from the drop-down menu. Enter your NSX-T username and password in the Username and Password fields, such as admin and VMware1!.
Click Send to execute the request and view the response in the Body tab. You should see a JSON object with the BGP routing table information, such as routes, next hops, prefixes, etc.
Click Save Response and select Save to a file from the drop-down menu. Enter API.txt as the file name and choose Desktop as the location. Click Save to save the output to your desktop.
SIMULATION
Task 13
You have been asked to configure the NSX backups for the environment so that if the NSX Manager fails it can be restored with the same IP address to the original primary Data Center that is in an Active / Standby configuration. Backups should be scheduled to run once every 24 hours as well as when there are changes published to the NSX environment. Ensure that backups are completed on their respective environment. Verify the backup file has been created on the SFTP server.
* Credentials needed to complete the task:

You need to:
* Verify that an SFTP server is available on the network and obtain SFTP Fingerprint.
* Configure NSX Backups via NSX Appliance Backup
* Configure Scheduling Criteria
Backup Configuration Criteria

Complete the requested task.
Notes: Passwords are contained in the user_readme.txt. This task is not dependent on other tasks. This task should take approximately 15 minutes to complete.
To configure the NSX backups for the environment, you need to follow these steps:
Verify that an SFTP server is available on the network and obtain SFTP fingerprint. You can use the search_web('SFTP server availability') tool to find some information on how to set up and check an SFTP server. You can also use the ssh-keyscan command to get the fingerprint of the SFTP server. For example, ssh-keyscan -t ecdsa sftp_server will return the ECDSA key of the sftp_server. You can compare this key with the one displayed on the NSX Manager UI when you configure the backup settings.
Configure NSX Backups via NSX Appliance Backup. Log in to the NSX Manager UI with admin credentials. The default URL is https://<nsx-manager-ip-address>. Select System > Lifecycle Management > Backup & Restore. Click Edit under the SFTP Server label to configure your SFTP server. Enter the FQDN or IP address of the backup file server, such as 10.10.10.100. The protocol text box is already filled in. SFTP is the only supported protocol. Change the default port if necessary. The default TCP port is 22. In the Directory Path text box, enter the absolute directory path where the backups will be stored, such as /dat
a. The directory must already exist and cannot be the root directory (/). Avoid using path drive letters or spaces in directory names; they are not supported. In the Passphrase text box, enter a passphrase that will be used to encrypt and decrypt the backup files, such as VMware1!. Click Save to create the backup configuration.
Configure Scheduling Criteria. On the Backup & Restore page, click Edit under the Schedule label to configure your backup schedule. Select Enabled from the drop-down menu to enable scheduled backups. Select Daily from the Frequency drop-down menu to run backups once every 24 hours. Select a time from the Time drop-down menu to specify when the backup will start, such as 12:00 AM. Select Enabled from the Additional Backup Trigger drop-down menu to run backups when there are changes published to the NSX environment. Click Save to create the backup schedule.
SIMULATION
Task 4
You are tasked with creating a logical load balancer for several web servers that were recently deployed.
You need to:


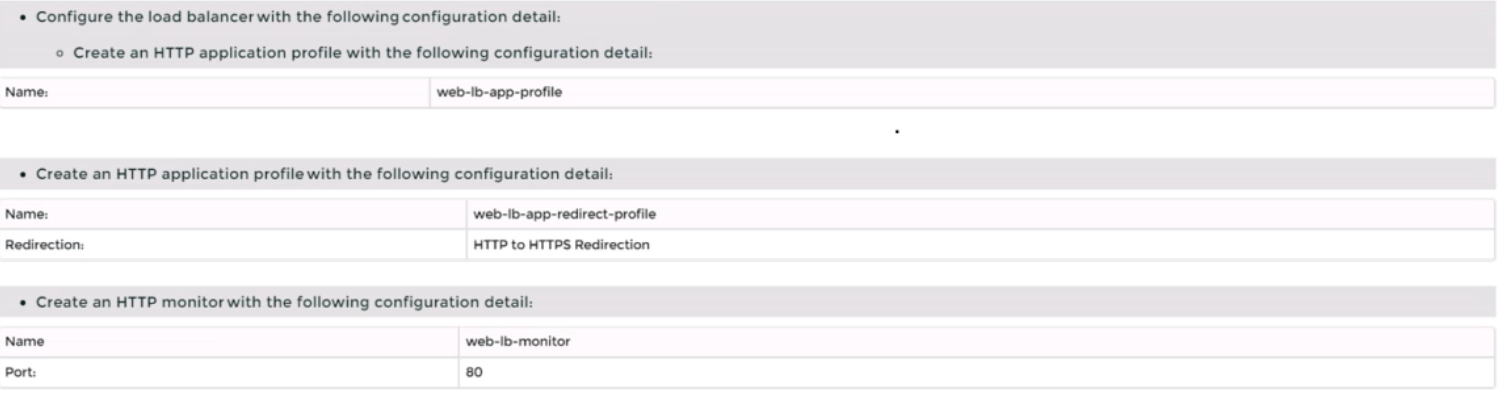
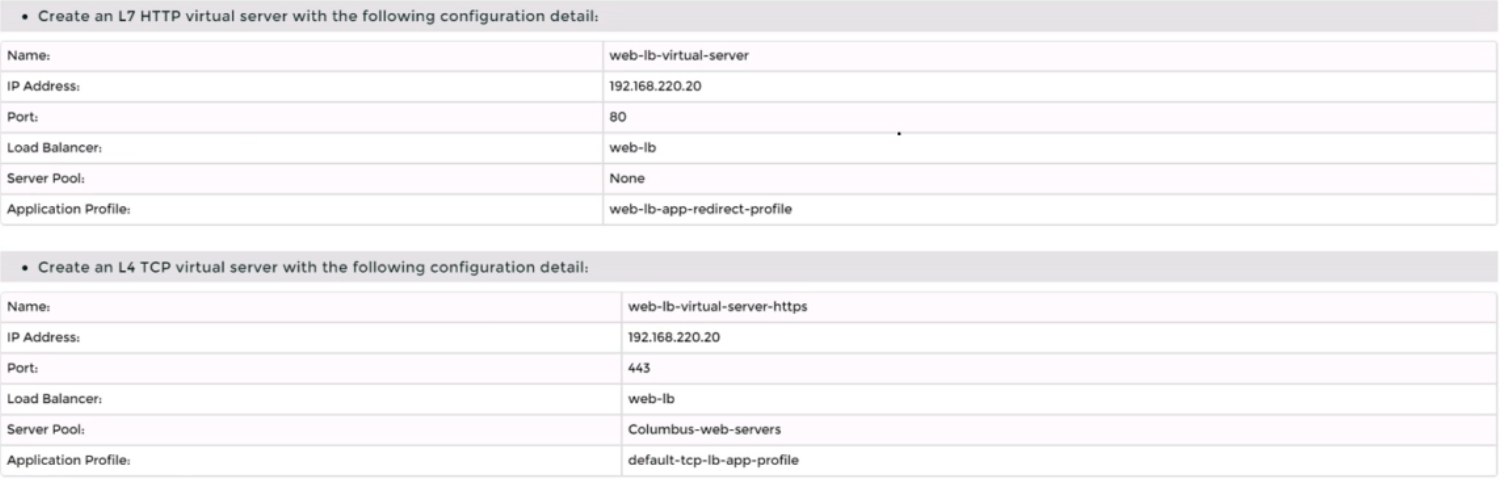
Complete the requested task.
Notes:
Passwords are contained in the user_readme.txt. Do not wait for configuration changes to be applied in this task as processing may take some time to complete. This task should take up to 35 minutes to complete and is required for subsequent tasks.
To create a logical load balancer for several web servers, you need to follow these steps:
Log in to the NSX Manager UI with admin credentials. The default URL is https://<nsx-manager-ip-address>.
Navigate to Networking > Load Balancing > Load Balancers and click Add Load Balancer.
Enter a name and an optional description for the load balancer. Select the tier-1 gateway where you want to attach the load balancer from the drop-down menu or create a new one by clicking New Tier-1 Gateway. Click Save.
Navigate to Networking > Load Balancing > Application Profiles and click Add Application Profile.
Enter a name and an optional description for the application profile. Select HTTP as the application type from the drop-down menu. Optionally, you can configure advanced settings such as persistence, X-Forwarded-For, SSL offloading, etc., for the application profile. Click Save.
Navigate to Networking > Load Balancing > Monitors and click Add Monitor.
Enter a name and an optional description for the monitor. Select HTTP as the protocol from the drop-down menu. Optionally, you can configure advanced settings such as interval, timeout, fall count, rise count, etc., for the monitor. Click Save.
Navigate to Networking > Load Balancing > Server Pools and click Add Server Pool.
Enter a name and an optional description for the server pool. Select an existing application profile from the drop-down menu or create a new one by clicking New Application Profile. Select an existing monitor from the drop-down menu or create a new one by clicking New Monitor. Optionally, you can configure advanced settings such as algorithm, SNAT translation mode, TCP multiplexing, etc., for the server pool. Click Save.
Click Members > Set > Add Member and enter the IP address and port number of each web server that you want to add to the server pool. For example, enter 192.168.10.10:80 and 192.168.10.11:80 for two web servers listening on port 80. Click Save and then Close.
Navigate to Networking > Load Balancing > Virtual Servers and click Add Virtual Server.
Enter a name and an optional description for the virtual server. Enter the IP address and port number of the virtual server that will receive the client requests, such as 10.10.10.100:80. Select HTTP as the service profile from the drop-down menu or create a new one by clicking New Service Profile. Select an existing server pool from the drop-down menu or create a new one by clicking New Server Pool. Optionally, you can configure advanced settings such as access log, connection limit, rate limit, etc., for the virtual server. Click Save.
SIMULATION
Task 8
You are tasked With troubleshooting the NSX IPSec VPN service Which has been reported down. Verify the current NSX configuration is deployed and resolve any issues.
You need to:
* Verify the present configuration as provided below:

Complete the requested task.
Notes: Passwords are contained in the user_readme.txt. This task is not dependent on another. This task Should take approximately 15 minutes to complete.
To troubleshoot the NSX IPSec VPN service that has been reported down, you need to follow these steps:
Log in to the NSX Manager UI with admin credentials. The default URL is https://<nsx-manager-ip-address>.
Navigate to Networking > VPN > IPSec VPN and select the IPSec VPN session that is down. You can identify the session by its name, local endpoint, remote endpoint, and status.
Click Show IPSec Statistics and view the details of the IPSec VPN session failure. You can see the error message, the tunnel state, the IKE and ESP status, and the statistics of the traffic sent and received.
Compare the configuration details of the IPSec VPN session with the expected configuration as provided below. Check for any discrepancies or errors in the parameters such as local and remote endpoints, local and remote networks, IKE and ESP profiles, etc.
If you find any configuration errors, click Actions > Edit and modify the parameters accordingly. Click Save to apply the changes.
If you do not find any configuration errors, check the connectivity and firewall rules between the local and remote endpoints. You can use ping or traceroute commands from the NSX Edge CLI to test the connectivity. You can also use show service ipsec command to check the status of IPSec VPN service on the NSX Edge.
If you find any connectivity or firewall issues, resolve them by adjusting the network settings or firewall rules on the NSX Edge or the third-party device.
SIMULATION
Task 1
You are asked to prepare a VMware NSX-T Data Center ESXi compute cluster Infrastructure. You will prepare two ESXi servers in a cluster for NSX-T overlay and VLAN use.
All configuration should be done using the NSX UI.
* NOTE: The configuration details in this task may not be presented to you in the order in which you must complete them.
* Configure a new Transport Node profile and add one n-VDS switch. Ensure Uplink 1 and Uplink 2 of your configuration use vmnic2 and vmnic3 on the host.

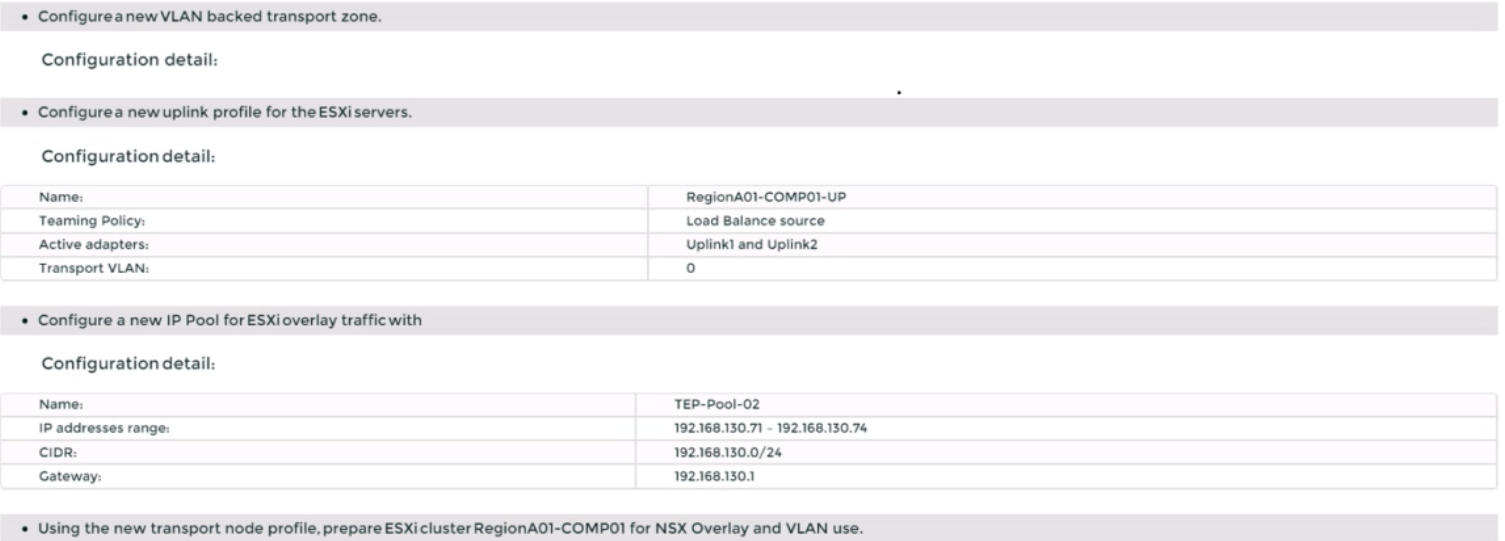
Complete the requested task.
NOTE: Passwords are contained in the user_readme.txt. Configuration details may not be provided in the correct sequential order. Steps to complete this task must be completed in the proper order. Other tasks are dependent on the completion Of this task. You may want to move to other tasks/steps while waiting for configuration changes to be applied. This task should take approximately 20 minutes to complete.
To prepare a VMware NSX-T Data Center ESXi compute cluster infrastructure, you need to follow these steps:
Log in to the NSX Manager UI with admin credentials. The default URL is https://<nsx-manager-ip-address>.
Navigate to System > Fabric > Profiles > Transport Node Profiles and click Add Profile.
Enter a name and an optional description for the transport node profile.
In the Host Switches section, click Set and select N-VDS as the host switch type.
Enter a name for the N-VDS switch and select the mode as Standard or Enhanced Datapath, depending on your requirements.
Select the transport zones that you want to associate with the N-VDS switch. You can select one overlay transport zone and one or more VLAN transport zones.
Select an uplink profile from the drop-down menu or create a custom one by clicking New Uplink Profile.
In the IP Assignment section, select Use IP Pool and choose an existing IP pool from the drop-down menu or create a new one by clicking New IP Pool.
In the Physical NICs section, map the uplinks to the physical NICs on the host. For example, map Uplink 1 to vmnic2 and Uplink 2 to vmnic3.
Click Apply and then click Save to create the transport node profile.
Navigate to System > Fabric > Nodes > Host Transport Nodes and click Add Host Transport Node.
Select vCenter Server as the compute manager and select the cluster that contains the two ESXi servers that you want to prepare for NSX-T overlay and VLAN use.
Select the transport node profile that you created in the previous steps and click Next.
Review the configuration summary and click Finish to start the preparation process.
Exam domains verified against: Official VMware 3V0-41.22 exam guide, last checked October 2026.
Section 1 topics are not applicable.
Section 2 topics are not applicable.
Section 3 topics are not applicable.
Deploy and configure VMware NSX-T Data Center infrastructure components, including management, control, and data plane elements. Set up transport zones, IP pools, and transport nodes to meet design requirements in single-site and multi-site environments.
Objective 5.1 - Configure and Manage Enhanced Data Path (N-VDSe); Objective 5.2 - Configure and Manage Quality of Service (QoS) settings
Sample question from this domain above: Q1
Objective 6.1 - Perform Advanced VMware NSX-T Data Center Troubleshooting; Objective 6.1.1 - Troubleshoot Common VMware NSX-T Data Center Installation/Configuration Issues; Objective 6.1.2 - Troubleshoot VMware NSX-T Data Center Connectivity Issues; Objective 6.1.3 - Troubleshoot VMware NSX-T Data Center Edge Issues; Objective 6.1.4 - Troubleshoot VMware NSX-T Data Center L2 and L3 services; Objective 6.1.5 - Troubleshoot VMware NSX-T Data Center Security services; Objective 6.1.6 - Utilize VMware NSX-T Data Center native tools to identify and troubleshoot issues
Sample question from this domain above: Q3
Objective 7.1 - Perform Operational Management of a VMware NSX-T Data Center Implementation; Objective 7.1.1 - Backup and Restore Network Configurations; Objective 7.1.2 - Monitor a VMware NSX-T Data Center Implementation; Objective 7.1.3 - Manage Role-Based Access Control; Objective 7.1.4 - Restrict management network access using VIDM access policies; Objective 7.1.5 - Manage syslog settings; Objective 7.2 - Utilize API and CLI to manage a VMware NSX-T Data Center Deployment; Objective 7.2.1 - Administer and Execute calls using the VMware NSX-T Data Center vSphere API
Common questions about the exam itself

