At ValidExamDumps, we consistently monitor updates to the Tableau Desktop-Certified-Associate exam questions by Tableau. Whenever our team identifies changes in the exam questions,exam objectives, exam focus areas or in exam requirements, We immediately update our exam questions for both PDF and online practice exams. This commitment ensures our customers always have access to the most current and accurate questions. By preparing with these actual questions, our customers can successfully pass the Tableau Desktop Certified Associate Exam exam on their first attempt without needing additional materials or study guides.
Other certification materials providers often include outdated or removed questions by Tableau in their Tableau Desktop-Certified-Associate exam. These outdated questions lead to customers failing their Tableau Desktop Certified Associate Exam exam. In contrast, we ensure our questions bank includes only precise and up-to-date questions, guaranteeing their presence in your actual exam. Our main priority is your success in the Tableau Desktop-Certified-Associate exam, not profiting from selling obsolete exam questions in PDF or Online Practice Test.
Connect to the "Global Superstore" data source and use the Orders table. Find out how many days in the 4th quarter of 2015 had a profit ratio greater than 25%?
Calculate the Profit Ratio:
Create a LOD expression -> for each order date if profit ratio is greater than 25% returns 1.
Drop the Order date to Rows and drill-down it to Quarters.
Drop the profit ratio >.25 field to Text:
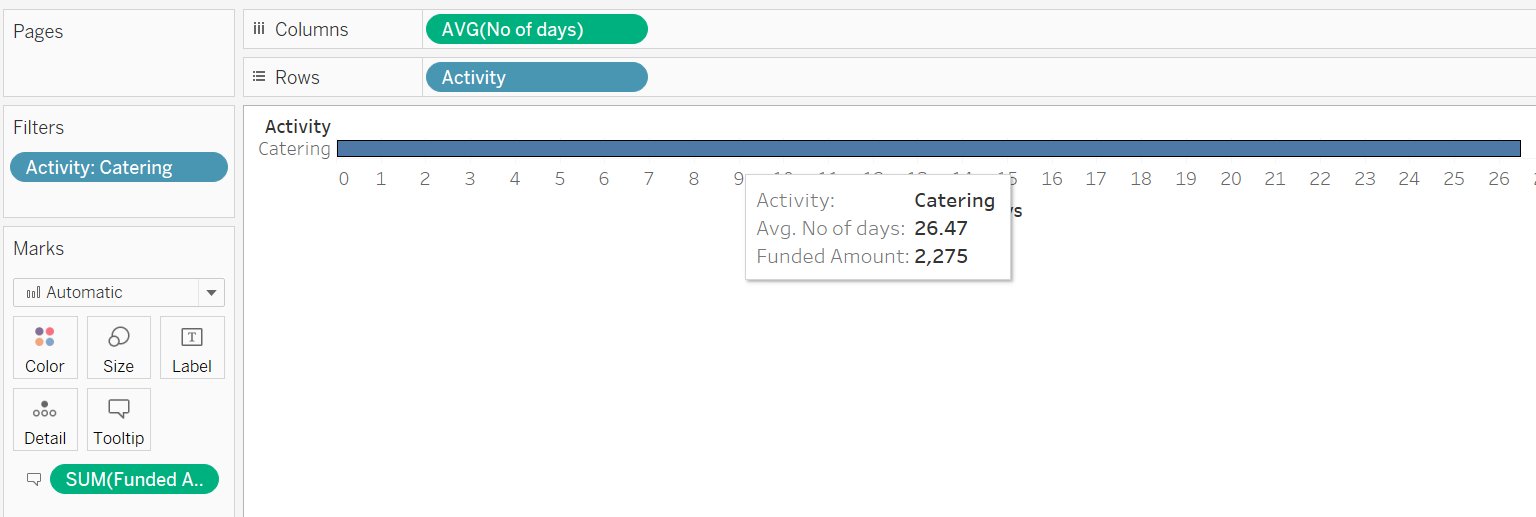
Connect to the "Kiva Loans - India" data source, find out the average number of days it took to disbursed the funded amount in catering activity, and what is the total funded amount?
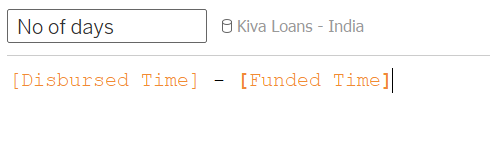
Filter the Activity = Catering
Drop the activity to rows, and no of days to columns, change the aggregation to AVG.
Also, drop the Funded Amount to the Tooltip.
Connect to the "Global Superstore" data source and use the Orders table. Find out how many new customers were acquired in the year 2014?
If customer first order is equal to the order date, then this is the new customer.
Create a calculated field to find the first order date:
Find If the order date is equal to the day of first purchase for that customer, flag that row as a
'New Customer'
Find the unique customers:
Drop the Order date to filter shelf and select the year 2014 to find out the new customer
acquired in 2014.
Drop New Customer field to Rows and Unique customer field to Text marks card.
Which type of sort is applied in the Ship Mode field?
Larger image
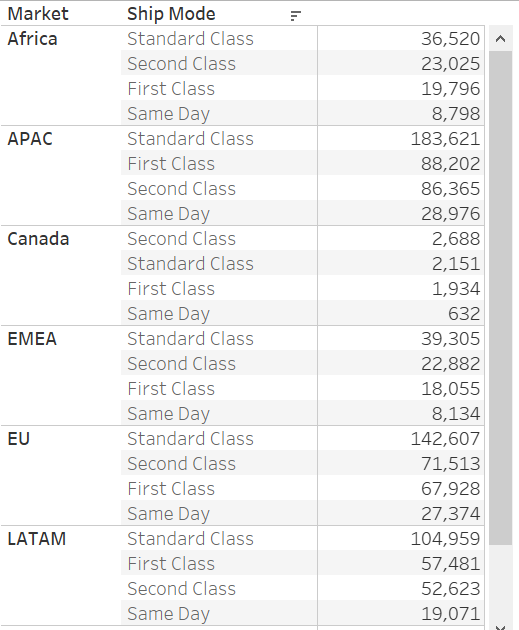
Refer to Nested Sort section: https://help.tableau.com/current/pro/desktop/en-us/sortgroup_sorting_computed_howto.htm
Connect to the "Significant Volcano Eruption" data source. Using the elevations field, create bins of size 1000 and find out in which bin has the most total deaths?
Select the 'Elevation' field from measures, and go to show me. Click on Histogram.
Right-Click on the 'Elevation (bin)' dimension and select Edit. Change the size of bins to 1000.
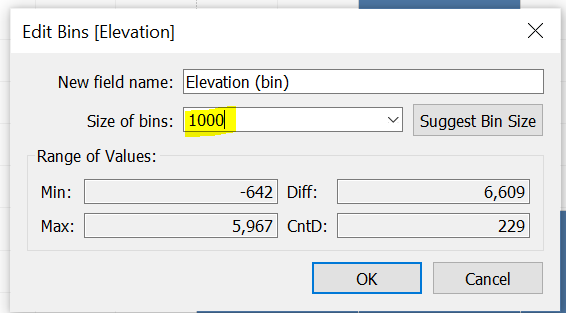
Drop the Total Death to Label.
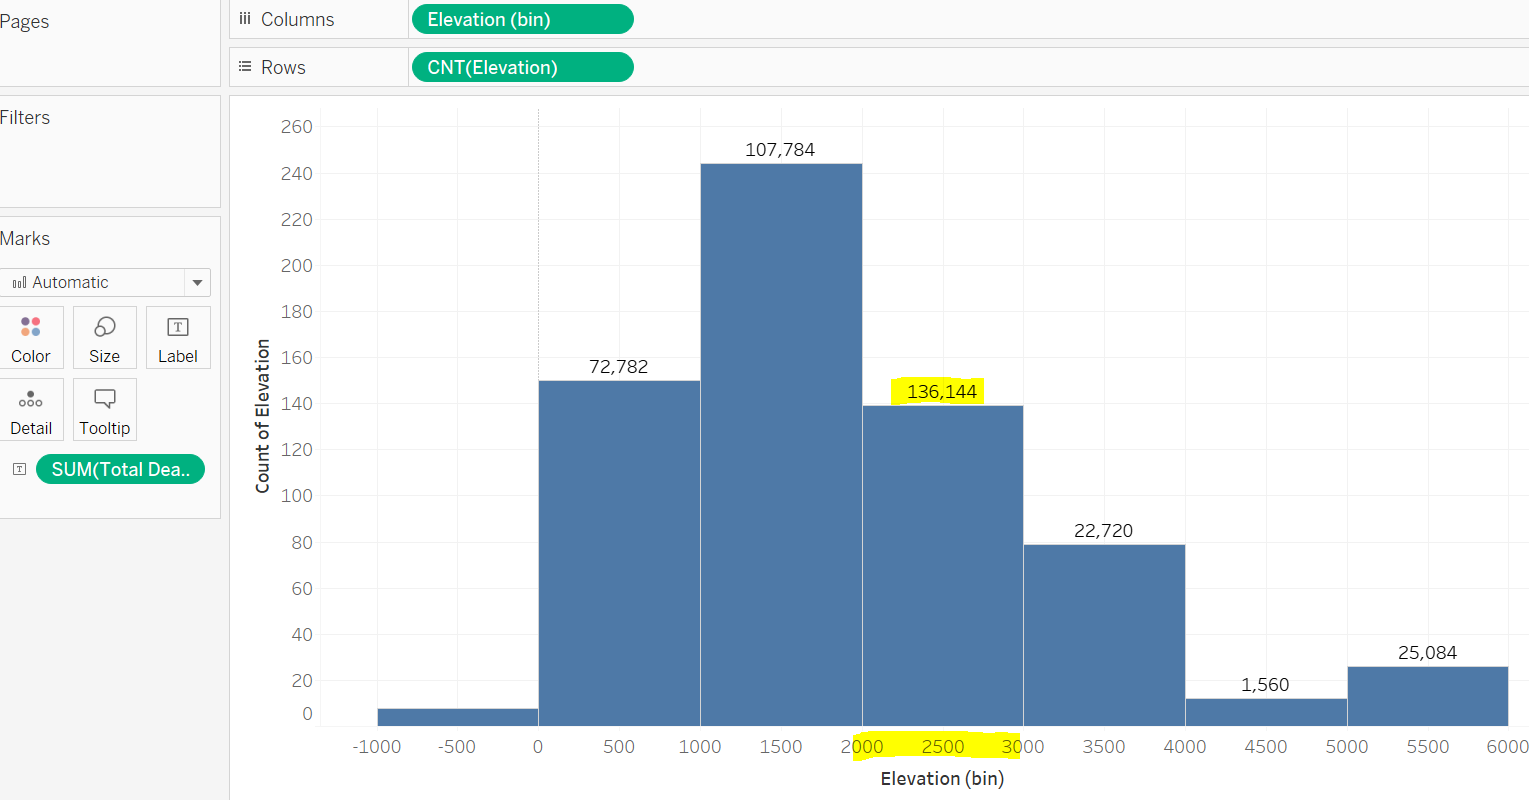
The total number of deaths reported in the bin of 2000.
Note that the lower limit is inclusive. So 2000 bin means 2000 to 2999.