Key details for this exam, checked against the published exam outline
Each question shows the correct answer and an explanation of why it is right
An implementation engineer is requested to apply the following logic:
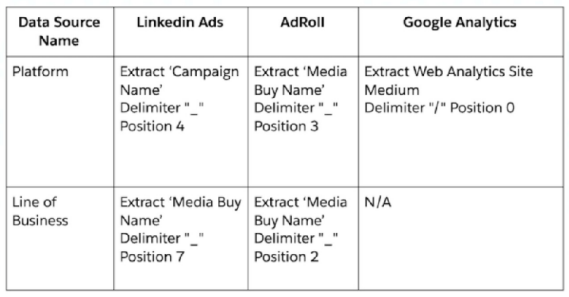
To apply the above logic, the engineer used only the Harmonization Center, without any mapping manipulations. What is the minimum amount of Patterns creating both 'Platform' and 'Line of Business'?"
To create both 'Platform' and 'Line of Business' fields using Patterns in the Harmonization Center without mapping manipulations, the engineer would need to create separate patterns for each data source mentioned. According to the provided images:
One pattern for LinkedIn Ads, to extract the 'Campaign Name' at position 4 for the Platform and 'Media Buy Name' at position 7 for Line of Business.
One pattern for AdRoll, to extract 'Media Buy Name' at position 3 for Platform and at position 2 for Line of Business.
One pattern for Google Analytics, which seems not required for the Platform but could apply if the Line of Business extraction is necessary, although it states N/A.
Hence, a minimum of 3 patterns would be necessary to create the fields required.
A client's data consists of three data sources - Facebook Ads, LinkedIn Ads and Google Campaign Manager.
Notes:
* The client is planning on adding an additional 100 Facebook Ads data streams and 50 more LinkedIn Ads data streams.
* The final volume of data in the workspace will be 5M rows
* Each data source has a naming convention and it can be assumed that any additional profile (i.e. Data Stream) from one of these sources will follow the same naming convention.
The client provided the following sample files:
Facebook Ads:
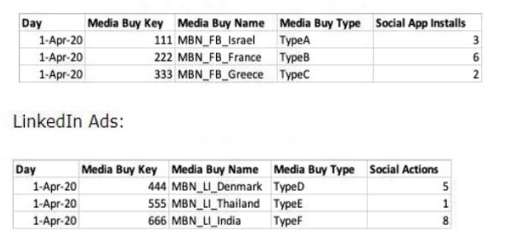
The client would like to create a new harmonization field named "Market," which will only be coming from Facebook Ads and LinkedIn Ads. The logic for
"Market" is the following:
IF Media Buy Type is equal to "TypeB" or "TypeC" or "TypeD"
Return 'Europe'
ELSE
Return 'Rest Of The World'
In order to create the harmonization field Market, the client considers using either Mapping Formula, Calculated Dimension, VLOOKUP or Patterns.
Considering maintenance and scalability, which option is recommended?
Patterns are the best approach in this scenario because:
Scalability: Patterns are highly scalable and can easily handle the addition of 100 more Facebook Ads and 50 more LinkedIn Ads streams. You can define pattern-matching rules that automatically apply to new data streams based on the naming conventions.
Flexibility and Maintenance: Patterns allow you to maintain and adjust logic easily. Since the logic for determining 'Market' is based on a defined naming convention (e.g., Media Buy Type), Patterns can handle these rules effectively without requiring manual updates or static tables.
Efficient Harmonization: Patterns automatically classify data based on defined rules, reducing the need for ongoing manual maintenance compared to approaches like VLOOKUP or Mapping Formulas, which might require frequent updates as data changes.
Why not other options?
Mapping Formulas: While Mapping Formulas work well for static mappings, they are not as scalable or maintainable when the dataset grows or changes frequently.
Calculated Dimension: This option is valid for simple logic but is less maintainable for large-scale datasets, especially when new data streams are added.
VLOOKUP: This method is manual and not scalable. It would require you to update lookup tables for each new data stream, which is inefficient given the expected growth of the data.
Source 3:
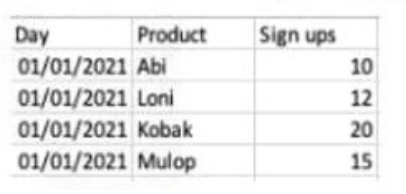
Via the harmonization Center, the Client has created Patterns and applied a classification rule using source 2.
While performing QA, you have spotted that the final value of clicks for Product Group Ais 10, where it should've been i5.

How can an implementation engineer fix this discrepancy?
Case Sensitivity Issue:
The discrepancy in the 'Clicks' value for Product Group A (10 instead of 15) likely arises from a mismatch caused by case sensitivity in the classification rules. If some data entries use different capitalization (e.g., 'Product Group A' vs. 'product group a'), the system might treat them as distinct entries, leading to incorrect aggregations.
Solution:
By unchecking the 'Case Sensitive' checkbox, the harmonization process will treat entries with different capitalization as the same value. This ensures consistent classification and resolves discrepancies in aggregated metrics like 'Clicks.'
A client has provided you with sample files of their data from the following data sources:
1.Google Analytics
2.Salesforce Marketing Cloud
The link between these sources is on the following two fields:
Message Send Key
A portion of: web_site_source_key
Below is the logic the client would like to have implemented in Datorama:
For 'web site medium' values containing the word ''email'' (in all of its forms), the section after the ''_'' delimiter in 'web_site_source_key' is a 4 digit
number, which matches the 'Message Send Key' values from the Salesforce Marketing Cloud file. Possible examples of this can be seen in the
following table:
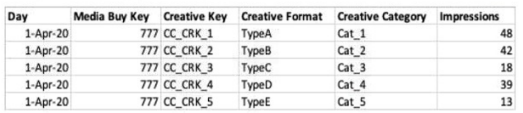
Google Analytics:

Salesforce Marketing Cloud:

The client's objective is to visualize the mutual key values alongside measurements from both files in a table.

In order to achieve this, what steps should be taken?
To create a linkage between Google Analytics and Salesforce Marketing Cloud data based on the 'Message Send Key' and a portion of the 'web_site_source_key,' both values need to be harmonized into a common key. This is done by mapping the full Message Send Key from Salesforce Marketing Cloud and the extracted part of the web_site_source_key from Google Analytics to the same Custom Classification Key. This mapping will create a common identifier that can be used to combine the data from both sources for analysis and visualization.
Ina workspace that contains one hundred data streams and a lot of data, what is the biggest downside of using calculated dimensions?
In a workspace with a high number of data streams, such as one hundred, the biggest downside of using calculated dimensions is the performance impact. Calculated dimensions require computational resources to dynamically compute values based on existing data. This can lead to increased load times and slower performance, especially in environments with large amounts of data or complex calculations. This performance degradation is due to the extra processing power needed every time the data is accessed or refreshed, impacting the overall efficiency of data retrieval and analysis operations.
An implementation engineer has been provided with 4 different source files: 03m 48s
1. Twitter Ads ~
2. Creative Classification
3. Placement Classification
4, Campaign Category Classification
The main source is Twitter Ads (which includes various fields and KPIs), and the rest are classification files that connect to Twitter Ads and enrich different fields within it.
The connections between the files are described as follows:
1st Party Creative Classification
File structure/headers:

Creative ID --- links back to Creative Key (Twitter Ads)
1st Party Placement Classification by
File structure/headers:

A)
B)
C)
D)
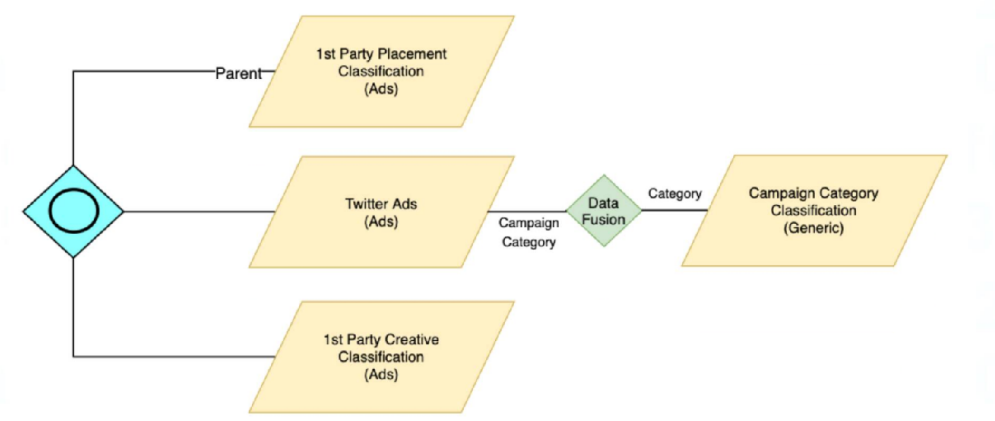
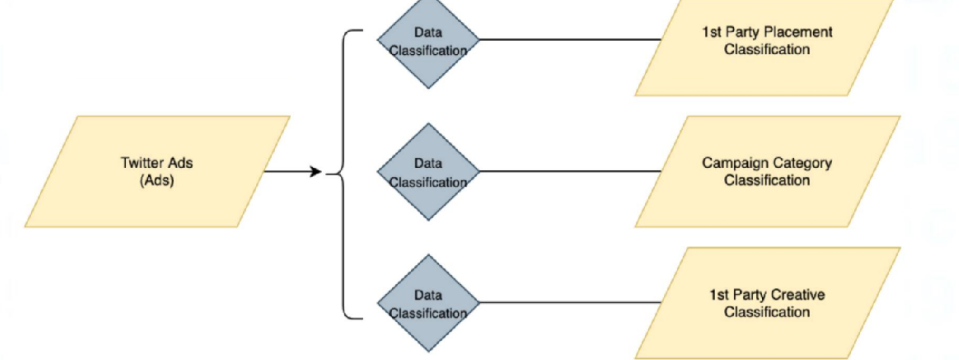
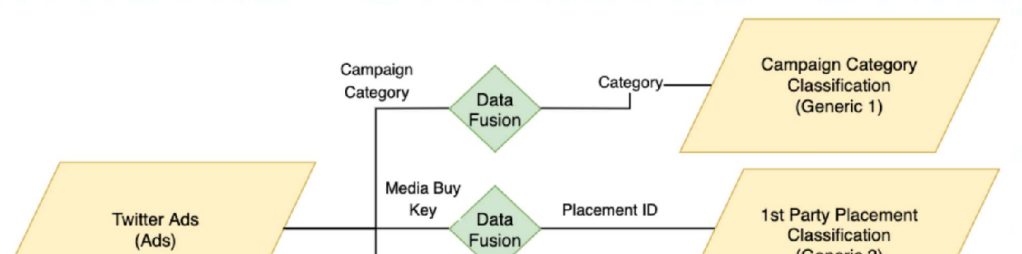
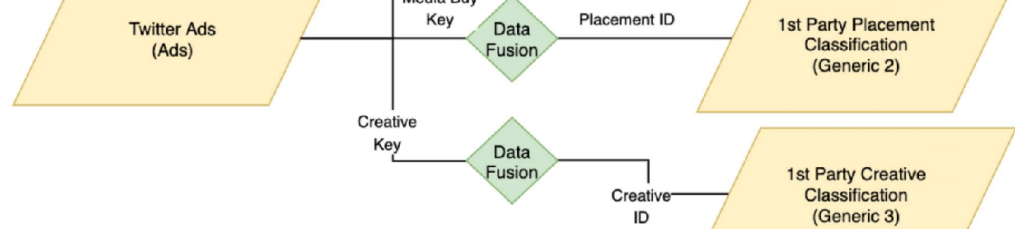
In Salesforce Marketing Cloud Intelligence, connections between source files and classification files are established through common keys that link data records. For this scenario:
The '1st Party Creative Classification' file has a 'Creative ID' field which corresponds to the 'Creative Key' in the 'Twitter Ads' data. This link enables enrichment of Twitter Ads data with creative classification details.
The '1st Party Placement Classification' file will contain a 'Placement ID' that connects to a corresponding field in the 'Twitter Ads' data, enabling the enrichment of placement classification details.
Option A appears to accurately depict this setup where data streams for 'Creative Classification' and 'Placement Classification' are connected to the 'Twitter Ads' data stream using the 'Creative ID' and 'Placement ID', respectively. This structure allows for the enhancement of the main Twitter Ads data with additional classification information.
A technical architect is provided with the logic and Opportunity file shown below:
The opportunity status logic is as follows:
For the opportunity stages ''Interest'', ''Confirmed Interest'' and ''Registered'', the status should be ''Open''.
For the opportunity stage ''Closed'', the opportunity status should be closed Otherwise, return null for the opportunity status.
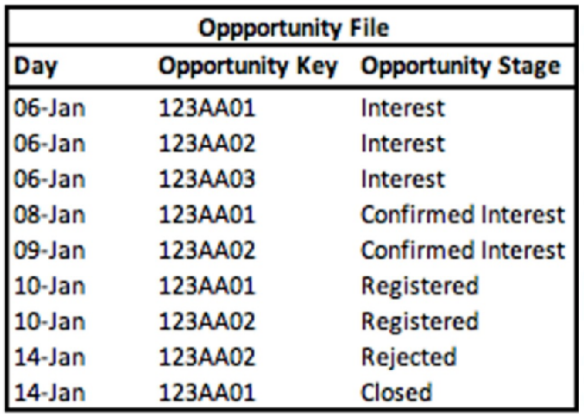
Given the above file and logic and assuming that the file is mapped in a generic data stream type with the following mapping
''Day'' --- Standard ''Day'' field
''Opportunity Key'' > Main Generic Entity Key
''Opportunity Stage'' + Generic Entity Key 2
A pivot table was created to present the count of opportunities in each stage. The pivot table is filtered on Jan 7th - 11th. Which option reflects the stage(s) the Opportunity key 123AA01 is associated with?
Analyzing the Opportunity file with a filter set from January 7th to 11th, Opportunity Key '123AA01' appears under 'Interest' on January 6th and 8th, and under 'Registered' on January 10th. Therefore, during the specified date range, Opportunity Key '123AA01' is associated with both 'Interest' and 'Registered' stages. Salesforce Marketing Cloud Intelligence provides the capability to map and track opportunity stages over time, allowing for historical stage tracking and reporting. This answer aligns with the ability to use pivot tables to filter and display data by specific attributes and timeframes, as outlined in the Salesforce Marketing Cloud Intelligence documentation.
Exam domains verified against: Official Salesforce Marketing-Cloud-Intelligence exam guide, last checked October 2026.
Understand core Marketing Cloud Intelligence platform capabilities and foundational concepts. Build knowledge of how the system works and its primary features for data analysis and reporting.
Master common Marketing Cloud Intelligence functions used in data workflows. Apply these functions to solve real-world data integration challenges on the platform.
Learn how Marketing Cloud Intelligence ingestion capabilities work and what outcomes they produce. Understand the practical effects of different mapping approaches.
Master Data Update permissions and their configuration settings. Know how parent-child setups work, including the Source of Truth requirement that governs data hierarchy.
Learn different harmonization methods and their properties. Weigh the pros and cons of each approach for your specific use cases.
Understand vlookup statements and their general properties within the platform. Know when and how to use vlookup to enrich and match data.
Learn what Overarching Entities are and when to apply them. Identify which use cases benefit from this feature and how to implement it correctly.
Know the use cases where Data Fusion adds value. Understand its properties and when to use it to combine data from multiple sources.
Master calculated objects and their functionalities on the platform. Recognize different aggregation types and when each one applies.
Sample question from this domain above: Q5
Understand Harmonization Center capabilities including Classification Rules, Validation Lists, Patterns and Harmonized Dimensions. Use these tools to standardize and validate data quality.
Learn how CRM properties work within Marketing Cloud Intelligence. Understand CRM behavior and how it integrates with the platform.
Know how to perform common quality assurance steps across various platform scenarios. Apply QA techniques to validate data, configurations and solution implementations.
Understand Marketing Cloud Intelligence data model entities and their relationships. Learn data categorization including main entities, keys and attributes.
Sample question from this domain above: Q7
Identify invalid solutions when reviewing solution design diagrams. Recognize valid solutions that meet requirements and best practices.
Common questions about the exam itself

