Key details for this exam, checked against the published exam outline
Each question shows the correct answer and an explanation of why it is right
Which two statements are true about disabling Automatic Shared Memory Management (ASMM)?
When ASMM is disabled, the sizes of the automatically managed SGA components remain at their current values. ASMM is controlled by the SGA_TARGET parameter. If SGA_TARGET is set to a non-zero value, ASMM is enabled and Oracle will automatically manage the sizes of the various SGA components. When ASMM is disabled, by setting SGA_TARGET to zero, the SGA components that were automatically sized will retain their current sizes rather than being reset to their original user-defined values. The overall size of the SGA remains the same unless manually changed by modifying individual component sizes or SGA_MAX_SIZE.
Oracle Database Administration Guide, 19c
Oracle Database Performance Tuning Guide, 19c
Which two types of performance problems are reported by ADDM for PDBS?
The Automatic Database Diagnostic Monitor (ADDM) analyzes and reports on various types of performance problems. For Pluggable Databases (PDBs), it can identify issues such as I/O capacity limits which may hinder the overall performance by causing bottlenecks. Additionally, ADDM can report on user I/O waits, which can indicate performance issues related to the time it takes for user queries to read data from the disk.
Oracle Multitenant Administrator's Guide, 19c
Oracle Database Performance Tuning Guide, 19c
This error occurred more than four hours ago in the database:
ORA-04036 PGA memory used by the instance exceeds PGA_AGGREGATE_LIMIT
You want to know which process and query were at fault.
Which two views should you use for this purpose?
To investigate the cause of the ORA-04036 error, which indicates that PGA memory usage exceeds the PGA_AGGREGATE_LIMIT, the appropriate views to consult are DBA_HIST_ACTIVE_SESS_HISTORY and DBA_HIST_PROCESS_MEM_SUMMARY.
DBA_HIST_ACTIVE_SESS_HISTORY: This view provides historical information about active sessions in the database. It includes details about the SQL executed, the execution context, and the resources consumed by each session. By examining this view, you can identify the specific sessions and SQL queries that were active and potentially consuming excessive PGA memory around the time the ORA-04036 error occurred.
DBA_HIST_PROCESS_MEM_SUMMARY: This view contains historical summaries of memory usage by processes. It can help in identifying the processes that were consuming a significant amount of PGA memory, leading to the ORA-04036 error. This view provides aggregated memory usage information over time, making it easier to pinpoint the processes responsible for high PGA memory consumption.
Together, these views offer a comprehensive overview of the memory usage patterns and specific queries or processes that might have contributed to exceeding the PGA_AGGREGATE_LIMIT, resulting in the ORA-04036 error.
Oracle Database Reference: DBA_HIST_ACTIVE_SESS_HISTORY
Examine this command:
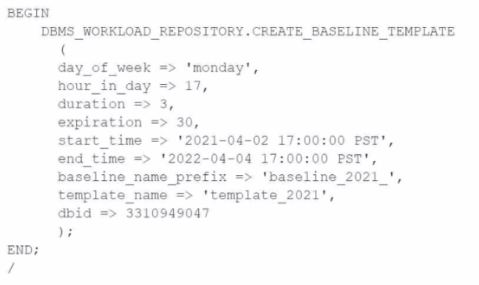
What is the maximum number of baselines generated by this command that you can have at any given time?
The DBMS_WORKLOAD_REPOSITORY.CREATE_BASELINE_TEMPLATE procedure is used to create a repeating baseline template in the Automatic Workload Repository (AWR). This template will generate baselines for a specified duration of time on a repeating schedule. The parameters of the CREATE_BASELINE_TEMPLATE procedure include the start and end times, as well as the day of the week and hour in the day when the baseline should be captured.
Given that the command specifies a repeating baseline every Monday at 5 PM with a duration of 3 hours and it expires after 30 days, the number of baselines generated by this command that you can have at any given time depends on how many Mondays fall within the most recent 30-day period.
Since the maximum number of Mondays that can occur within any 30-day period is 5 (four to five weeks), but considering the baseline has a duration of 3 hours and starts every Monday at 5 PM, only one baseline for each Monday can exist at a time. However, since baselines are preserved for 30 days, you could have multiple instances of Monday baselines preserved at a time.
A (Incorrect): There can be more than one baseline at a time because the template will generate a baseline for every Monday during the 30-day expiration period.
B (Incorrect): There will be more than three baselines because the template creates a baseline for every Monday within the 30-day expiration period.
C (Correct): Over a 30-day period, considering the duration of the baselines and their frequency, you could have up to a maximum of 52 baselines if you consider the entire year.
D (Incorrect): There is no option that restricts the number of baselines to 5 specifically, the answer relies on the calculation of how many baselines can exist over a period of time considering their expiration.
Oracle Database PL/SQL Packages and Types Reference: DBMS_WORKLOAD_REPOSITORY
Users complain about slowness and session interruptions. Additional checks reveal the following error in the application log:

Which file has additional information about this error?
When an ORA-00060 deadlock error occurs, detailed information about the error and the deadlock graph are dumped into the alert log. This log contains a trace file name that you can use to find additional detailed information about the sessions involved in the deadlock and the SQL statements they were executing. Reference:
Oracle Database Administrator's Guide, 19c
Oracle Database Error Messages, 19c
You use SQL Tuning Advisor to tune a given SQL statement.
The analysis eventually results in the implementation of a SQL Profile.
You then generate the new SQL Profile plan and enforce it using a SQL Plan Baseline but forget to disable the SQL Profile and a few days later you find out that the SQL Profile is generating a new execution plan.
Which two statements are true?
When both a SQL Profile and a SQL Plan Baseline are in place, the SQL Profile has a stronger preference and the optimizer is more likely to choose the execution plan from the SQL Profile.
C) A SQL Profile is generally more influential than a SQL Plan Baseline because it contains additional statistics and directives that help the optimizer to generate a more efficient execution plan. If both exist, the optimizer will use the profile's plan unless the baseline's plan is proven to be better through the SQL performance monitoring process.
E) SQL Plan Baselines must be accepted before they can be used by the optimizer. If a SQL Plan Baseline is not accepted, it will not be considered for generating the execution plan. Therefore, the presence of an unaccepted SQL Plan Baseline will not automatically force the optimizer to use its plan.
Oracle Database SQL Tuning Guide, 19c
Oracle Database Administrator's Guide, 19c
Database performance has degraded recently.
index range scan operations on index ix_sales_time_id are slower due to an increase in buffer gets on sales table blocks.
Examine these attributes displayed by querying DBA_TABLES:

Now, examine these attributes displayed by querying DBA_INDEXES:

Which action will reduce the excessive buffer gets?
Given that index range scan operations on IX_SALES_TIME_ID are slower due to an increase in buffer gets, the aim is to improve the efficiency of the index access. In this scenario:
B (Correct): Re-creating the index using ADVANCED COMPRESSION can reduce the size of the index, which can lead to fewer physical reads (reduced I/O) and buffer gets when the index is accessed, as more of the index can fit into memory.
The other options would not be appropriate because:
A (Incorrect): Re-creating the SALES table sorted in order of the index might not address the issue of excessive buffer gets. Sorting the table would not improve the efficiency of the index itself.
C (Incorrect): Using the columns in IX_SALES_TIME_ID as a hash partitioning key for the SALES table is more relevant to data distribution and does not necessarily improve index scan performance.
D (Incorrect): Hash partitioning the index is generally used to improve the scan performance in a parallel query environment, but it may not reduce the number of buffer gets in a single-threaded query environment.
Exam domains verified against: Official Oracle 1Z0-084 exam guide, last checked October 2026.
Understand foundational approaches to identifying performance bottlenecks, including the use of wait events, response time analysis, and diagnostic utilities to establish baseline performance metrics.
Master the installation and configuration of Statspack to collect diagnostic data and analyze performance issues. Learn to identify bottlenecks in the database and eliminate them systematically.
Use trace and log files to gain valuable insights into system behavior and resource usage. Monitor how database components utilize resources and apply findings to improve performance.
Sample question from this domain above: Q5
Monitor performance using metric thresholds and alerts to identify anomalies early. Work with AWR baselines to establish effective diagnosis and detection of performance degradation.
Sample question from this domain above: Q4
Diagnose performance problems using the Automated Database Diagnostic Monitor (ADDM) and Active Session History (ASH) reports. Streamline performance functions and increase database reliability.
Sample question from this domain above: Q2
Implement real-time monitoring of the database to actively identify low performance conditions. Use services and tools to assist efficient monitoring of database application performance.
Understand the phases of SQL statement processing to optimize query execution. Improve poorly written SQL statements and implement dynamic execution plans to enhance performance management.
Use the SQL Performance Analyzer to test database changes robustly. Employ Database Replay to evaluate the impact of system changes on efficiency and inform decisions.
Manage optimizer statistics effectively using tools such as the Optimizer Statistics Advisor. Apply SQL Access Advisor and SQL Plan Management to optimize query performance.
Sample question from this domain above: Q6
Diagnose and resolve performance problems related to the shared pool. Optimize the Result Cache and ensure adequate memory utilization to improve database functionality.
Diagnose and mitigate buffer cache performance problems and address database I/O issues. Configure Big Table Caching and Flash Cache to optimize data access patterns.
Configure Automatic Shared Memory Management and Automatic Memory Management features. Improve memory resource allocation and enhance memory performance across Oracle databases.
Sample question from this domain above: Q1
Configure and use the in-memory column store to improve SQL functionality and database responsiveness. Integrate in-memory features with other database components for optimal results.
Understand foundational approaches to identifying performance bottlenecks, including the use of wait events, response time analysis, and diagnostic utilities to establish baseline performance metrics.
Understand how statistics impact optimizer behavior and query execution plans. Fine tune parameters and configuration to influence optimizer decisions and improve query performance.
Address space problems using shrinking techniques and manage data storage and retrieval. Apply compression techniques to improve I/O performance and reduce overall database costs.
Sample question from this domain above: Q7
Diagnose and resolve performance problems pertaining to the Program Global Area (PGA). Address ineffective memory usage and configuration issues to enhance system stability and memory utilization.
Sample question from this domain above: Q3
Common questions about the exam itself

