The APICS Certified Supply Chain Professional (CSCP) exam validates your ability to plan, execute, and optimize supply chain operations across end-to-end workflows. This certification is designed for supply chain professionals who want to demonstrate competency in demand management, logistics, sourcing, and risk mitigation. This page guides you through the exam structure, core topics, and effective study strategies to help you prepare with confidence.
Use this topic map to guide your study for APICS CSCP (APICS Certified Supply Chain Professional) within the Certified Supply Chain Professional path.
The CSCP exam uses multiple question types to measure both foundational knowledge and applied reasoning in real supply chain scenarios.
Questions progress in difficulty and emphasize decision-making that mirrors real-world supply chain challenges.
An effective study plan breaks the syllabus into manageable weekly blocks, combines concept review with practice, and builds test stamina through realistic drills. Allocate 4-6 weeks of consistent study, depending on your supply chain background and current knowledge gaps.
Explore other APICS certifications: view all APICS exams.
Strengthen your preparation with up-to-date resources from validexamdumps.com. These materials align to CSCP and cover practical scenarios with clear explanations.
Visit the exam page to download the PDF, Online Practice Test, or get Bundle Discount offer for both formats: APICS Certified Supply Chain Professional.
Supply Chains and Demand Management, Internal Operations and Inventory, and Sourcing typically account for a larger portion of exam questions. However, all seven domains are tested, so balanced preparation across all topics is essential. Review the APICS exam blueprint to confirm current topic weightings.
Demand forecasting (Supply Chains and Demand Management) drives production plans (Internal Operations), which trigger supplier orders (Sourcing) and inbound logistics (Forward and Reverse Logistics). Inventory levels buffer against risk (Supply Chain Risk), relationships with partners enable collaboration (Supply Chain Relationships), and technology and sustainability practices (Optimization, Sustainability, and Technology) improve the entire network. Understanding these connections helps you answer scenario questions more effectively.
Experience with ERP systems (SAP, Oracle, NetSuite) or supply chain planning tools strengthens your ability to answer questions about MRP, demand planning, and inventory management. If you lack hands-on access, focus on understanding system outputs (exception messages, reports, dashboards) and the logic behind configuration decisions. Case studies and scenario practice can bridge this gap.
Misreading scenario details and jumping to answers without analyzing context is frequent. Confusing similar concepts (e.g., safety stock vs. reorder point, push vs. pull systems) also leads to lost points. Many candidates underestimate the importance of total cost of ownership in sourcing decisions. Slow reading and lack of time management on longer scenarios can also prevent you from completing all questions.
Dedicate the final week to timed practice tests, review of weak topic areas, and quick reference sheets for formulas and definitions. Avoid learning new material; instead, reinforce what you already know. Get adequate sleep the nights before the exam, and review exam logistics (location, check-in time, rules) to reduce day-of stress. On exam day, read each question carefully, manage your time, and flag difficult items to revisit if time permits.
Which of the following factors is the most appropriate measure of delivery performance for finished goods?
Perfect order fulfillment is the most appropriate measure of delivery performance for finished goods because it encompasses several key aspects of delivery performance, including:
Comprehensive Metric: Perfect order fulfillment measures not just on-time delivery, but also order completeness, accuracy, and condition. It provides a holistic view of how well the supply chain is meeting customer expectations.
Customer Satisfaction: This metric directly impacts customer satisfaction since it reflects the ability to deliver the correct products, in the correct quantities, at the correct time, and in acceptable condition.
Higher Standards: It sets a higher standard for delivery performance than just on-time delivery, as it requires excellence in multiple areas of order fulfillment.
Performance Improvement: By focusing on perfect order fulfillment, companies can identify and address various issues in their supply chain processes, leading to overall performance improvement.
On-time delivery (Option B) is important but only one component of the broader perfect order fulfillment metric. Load efficiency (Option C) relates more to transportation efficiency rather than customer delivery performance. Available-to-promise (Option D) is a planning tool to communicate delivery capabilities but does not measure actual delivery performance.
Reference
'Supply Chain Metrics that Matter' by Lora M. Cecere.
'Supply Chain Management: Strategy, Planning, and Operation' by Sunil Chopra and Peter Meindl.
Which of the following manufacturing strategies would run the greatest risk of increasing obsolete inventory costs?
Make-to-stock (MTS) is a manufacturing strategy where products are produced based on anticipated customer demand and then held in inventory until sold. The primary risk associated with MTS is the possibility of overestimating demand, which can lead to excess inventory. If the forecasted demand does not materialize, the unsold inventory may become obsolete, leading to increased costs associated with storage, depreciation, and potential disposal. In contrast, the other strategies---assemble-to-order (ATO), make-to-order (MTO), and engineer-to-order (ETO)---are more demand-driven, producing goods in response to actual customer orders, thus reducing the risk of holding obsolete inventory. Reference:
Chopra, S., & Meindl, P. (2016). Supply Chain Management: Strategy, Planning, and Operation. Pearson.
Stevenson, W. J. (2021). Operations Management. McGraw-Hill Education.
A company is determining where it should manufacture a product weighing 1 lb. for the Chicago market with a demand of 100,000 items per year. Costs for each of four possible locations are summarized in the table below. If the company wants to minimize the total cost to supply the items to the Chicago market, where should the items be produced?
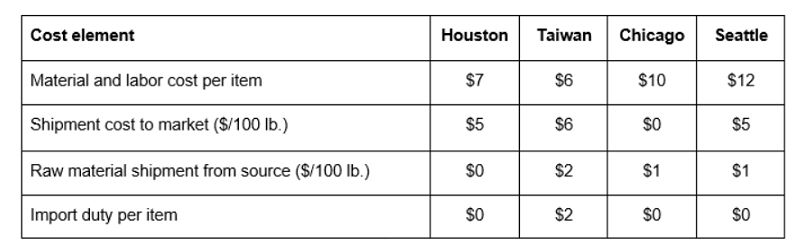
To find the total cost of supplying the items to the Chicago market from each location, we need to multiply the demand (100,000 items) by the sum of the material and labor cost per item, the shipment cost to market per item, and the import duty per item. The shipment cost to market per item can be obtained by dividing the shipment cost to market per 100 lb. by 100, since each item weighs 1 lb. The raw material shipment from source cost is irrelevant for this question, since it does not affect the total cost to supply the items to the Chicago market. Using this formula, we can calculate the total cost for each location as follows:
Houston: 100,000 x ($7 + $5/100 + $0) = $712,000
Taiwan: 100,000 x ($6 + $6/100 + $2) = $814,000
Chicago: 100,000 x ($10 + $0/100 + $0) = $1,000,000
Seattle: 100,000 x ($12 + $5/100 + $0) = $1,205,000
The location with the lowest total cost is Chicago, with $1,000,000. Therefore, the items should be produced in Chicago to minimize the total cost to supply the items to the Chicago market.
In an advanced planning system, which of the following modules feeds the master planning module?
In an advanced planning system (APS), the demand planning module feeds the master planning module. Demand planning involves forecasting customer demand and creating a demand plan that considers historical data, market trends, and other factors. This information is crucial for the master planning module, which uses it to develop production, procurement, and inventory plans to meet the forecasted demand efficiently.
Purchasing planning focuses on procurement activities and is influenced by the master plan.
Distribution planning deals with the logistics of distributing products and relies on the master plan.
Fulfillment planning involves ensuring customer orders are fulfilled, also based on the master plan.
Stadtler, H., Kilger, C., & Meyr, H. (2014). 'Supply Chain Management and Advanced Planning: Concepts, Models, Software, and Case Studies.'
Chopra, S., & Meindl, P. (2016). 'Supply Chain Management: Strategy, Planning, and Operation.'
Which of the following actions typically is most important when building a collaborative supply chain?
Building a collaborative supply chain relies heavily on establishing strong, trust-based relationships among all parties involved. Mutual trust is the foundation of collaboration, fostering open communication, shared goals, and a willingness to work together for mutual benefit. When trust is present, partners are more likely to share critical information, coordinate activities, and support each other during disruptions. While investing capital, integrating information systems, and developing a common culture are important, they are secondary to the fundamental requirement of trust, which enables all other collaborative efforts to be more effective.
Barratt, M., & Oliveira, A. (2001). Exploring the Concept of Supply Chain Collaboration. International Journal of Logistics Management.
Simatupang, T. M., & Sridharan, R. (2005). The Collaboration Index: A Measure for Supply Chain Collaboration. International Journal of Physical Distribution & Logistics Management.