Key details for this exam, checked against the published exam outline
Each question shows the correct answer and an explanation of why it is right
You have been tasked with creating a YARA-L detection rule in Google Security Operations (SecOps). The rule should identify when an internal host initiates a network connection to an external IP address that the Applied Threat Intelligence Fusion Feed associates with indicators attributed to a specific Advanced Persistent Threat 41 (APT41) threat group. You need to ensure that the external IP address is flagged if it has a documented relationship to other APT41 indicators within the Fusion Feed. How should you configure this YARA-L rule?
Comprehensive and Detailed Explanation
The correct solution is Option B. This question tests the advanced detection capabilities of YARA-L when using the Applied Threat Intelligence (ATI) Fusion Feed.
The key requirement is to find an IP that not only matches but has a documented relationship to APT41. The ATI Fusion Feed is not just a flat list of IOCs; it is a context-rich graph of indicators, malware, threat actors, and their relationships, managed by Google's threat intelligence teams.10
Option A is incorrect because it describes a manual, static list (data table) and cannot query the relationships in the live feed.
Option C is incorrect because it is too generic ('high confidence score,' 'any feed'). The requirement is specific to the ATI Fusion Feed and APT41.
Option D is incorrect because it describes a post-detection SOAR action. The question explicitly asks how to configure the YARA-L detection rule itself to perform this correlation.
Option B is the only one that describes the correct YARA-L 2.0 methodology. The rule must first define the live event (network connection). Then, it must define the context source (the ATI Fusion Feed). In the events section of the rule, a join is established between the event's external IP field and the IP indicator in the Fusion Feed. Finally, the rule filters the joined context data, looking for attributes such as threat.threat_actor.name = 'APT41' or other related_indicators that link back to the specified threat group.
Exact Extract from Google Security Operations Documents:
Applied Threat Intelligence Fusion Feed overview: The Applied Threat Intelligence (ATI) Fusion Feed is a collection of Indicators of Compromise (IoCs), including hashes, IPs, domains, and URLs, that are associated with known threat actors, malware strains, active campaigns, and finished intelligence reporti11ng.12
Write YARA-L rules with the ATI Fusion Feed: Writing YARA-L rules that use the ATI Fusion Feed follows a similar process to writing YARA-L rules that use other context entity sources.13 To write a rule, you filter the selected context entity graph (in this case, Fusion Feed).14
You can join a field from the context entity and UDM event field. In the following example, the placeholder variable ioc is used to do a transitive join between the context entity and the event.
Because this rule can match a large number of events, it is recommended that you refine the rule to match on context entities that have specific intelligence. This allows you to filter for explicit associations, such as a specific threat group or an indicator's presence in a compromised environment.
Google Cloud Documentation: Google Security Operations > Documentation > Detections > Applied Threat Intelligence Fusion Feed overview
Google Cloud Documentation: Google Security Operations > Documentation > Detections > Create context-aware analytics
You were recently hired as a SOC manager at an organization with an existing Google Security Operations (SecOps) implementation. You need to understand the current performance by calculating the mean time to respond or remediate (MTTR) for your cases. What should you do?
Comprehensive and Detailed 150 to 250 words of Explanation From Exact Extract Google Security Operations Engineer documents:
Google Security Operations (SecOps) SOAR is designed to natively measure and report on key SOC performance metrics, including MTTR. This calculation is automatically derived from playbook case stages.
As a case is ingested and processed by a SOAR playbook, it moves through distinct, customizable stages (e.g., 'Triage,' 'Investigation,' 'Remediation,' 'Closed'). The SOAR platform automatically records a timestamp for each of these stage transitions. The time deltas between these stages (e.g., the time from when a case entered 'Triage' to when it entered 'Remediation') are the raw data used to calculate MTTR and other KPIs.
This data is then aggregated and visualized in the built-in SecOps SOAR reporting and dashboarding features. This is the standard, out-of-the-box method for capturing these metrics. Option C describes a manual, redundant process of what case stages do automatically. Option D describes where the data might be viewed (Looker), but Option B describes the underlying mechanism for how the MTTR data is captured in the first place, which is the core of the question.
(Reference: Google Cloud documentation, 'Google SecOps SOAR overview'; 'Manage playbooks'; 'Get insights from dashboards and reports')
You need to augment your organization's existing Security Command Center (SCC) implementation with additional detectors. You have a list of known IoCs and would like to include external signals for this capability to ensure broad detection coverage. What should you do?
Comprehensive and Detailed 150 to 250 words of Explanation From Exact Extract Google Security Operations Engineer documents:
The correct solution is to create an Event Threat Detection (ETD) custom module. ETD is the Security Command Center (SCC) service designed to analyze logs for active threats, anomalies, and malicious behavior. The user's requirement is to use a list of known Indicators of Compromise (IoCs) and external signals, which directly aligns with the purpose of ETD.
In contrast, Security Health Analytics (SHA), mentioned in options A and B, is a posture management service. SHA custom modules are used to detect misconfigurations and vulnerabilities in resource settings, not to analyze log streams for threat activity based on IoCs.
Event Threat Detection provides pre-built templates for creating custom modules to simplify the detection engineering process. The 'Configurable Bad IP' template is specifically designed for this exact use case. It allows an organization to upload and maintain a list of known malicious IP addresses (a common form of external IoC). ETD will then continuously scan relevant log sources, such as VPC Flow Logs, Cloud DNS logs, and Cloud NAT logs. If any activity to or from an IP address on this custom list is detected, ETD automatically generates a CONFIGURABLE_BAD_IP finding in Security Command Center for review and response. This approach is the native, efficient, and supported method for integrating IP-based IoCs into SCC, unlike option D which requires building a complex, manual pipeline.
(Reference: Google Cloud documentation, 'Overview of Event Threat Detection custom modules'; 'Using Event Threat Detection custom module templates')
You are implementing Google Security Operations (SecOps) for your organization. Your organization has their own threat intelligence feed that has been ingested to Google SecOps by using a native integration with a Malware Information Sharing Platform (MISP). You are working on the following detection rule to leverage the command and control (C2) indicators that were ingested into the entity graph.
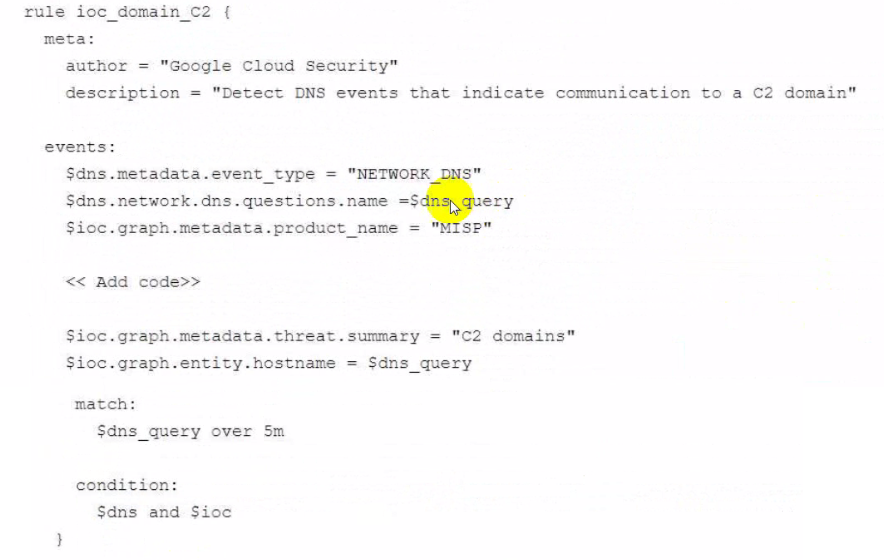
What code should you add in the detection rule to filter for the domain IOCS?
This YARA-L rule is designed to correlate a real-time event (a DNS query, $dns) with known-bad indicators stored in the Google SecOps entity graph ($ioc). The code must correctly filter the entity graph to find the specific indicators from the custom MISP feed.
Two filters are required:
$ioc.graph.metadata.entity_type = 'DOMAIN_NAME': This line is essential to filter the entity graph for IoCs that are domains. The rule is trying to match a DNS query ($dns_query) to a known C2 domain, so the entity type must be DOMAIN_NAME.
$ioc.graph.metadata.source_type = 'ENTITY_CONTEXT': This is the key differentiator. The Google SecOps entity graph has multiple context sources. GLOBAL_CONTEXT (Option B) is for threat intelligence provided by Google (e.g., Google Threat Intelligence, Mandiant). DERIVED_CONTEXT (Option C) is for context inferred from UDM events. The prompt explicitly states the IoC feed is the organization's own 'threat intelligence feed... ingested... with... MISP.' This type of customer-provided, third-party intelligence is classified as ENTITY_CONTEXT. Adding this line ensures the rule only uses the custom MISP feed for its IoC data, as intended.
The other lines in the $ioc block, such as product_name = 'MISP', further refine this ENTITY_CONTEXT search.
(Reference: Google Cloud documentation, 'YARA-L 2.0 language syntax'; 'Context-aware detections with entity graph'; 'Populate the entity graph')
Your organization is a Google Security Operations (SecOps) customer. The compliance team requires a weekly export of case resolutions and SLA metrics of high and critical severity cases over the past week. The compliance team's post-processing scripts require this data to be formatted as tabular data in CSV files, zipped, and delivered to their email each Monday morning. What should you do?
Comprehensive and Detailed Explanation
The correct solution is Option C. Google SecOps SOAR has a specific feature designed for this exact use case: Advanced Reports.
The standard 'SOAR Reports' (Option A) are pre-canned dashboard-style reports (e.g., Management - SOC Status). However, the 'Advanced Reports' feature (built on Looker) provides a powerful, flexible interface for building highly customized, tabular reports based on case data. This allows an administrator to specifically query for case resolutions and SLA metrics, and filter them by priority = High OR Critical.
Most importantly, the Advanced Reports feature has a built-in scheduler. This scheduler can be configured to run the report at a specific cadence (e.g., 'Weekly on Monday at 9:00 AM'), send it to a list of email recipients, and attach the data in the required format, including CSV and as a zipped file.
Option B is incorrect because detection rules create alerts, they don't report on case metrics. Option D is incorrect because it mixes the SIEM search function with a SOAR job, which is an overly complex and unnecessary way to query case data that is already structured within the SOAR module.
Exact Extract from Google Security Operations Documents:
Explore advanced SOAR reports: The default advanced SOAR reports are a set of dashboards and reports to help track SOC performance, case handling, analyst workload, and automation efficiency. These reports provide both high-level and detailed insights across your environments.1
SLA Monitoring: Use Triage Time and SLA Met flag to monitor SLA compliance and improve case handling.
Manage advanced reports: You can create, edit, duplicate, share, download, and delete advanced reports.
Schedule a report:
Select the report you want to schedule.
Select the Scheduler tab and click Add.
In the New Schedule dialog, click the Enable toggle to turn on scheduling and enter the required information (e.g., weekly, Monday, email recipients).
You can select the delivery format, including CSV and ZIP attachments.
Google Cloud Documentation: Google Security Operations > Documentation > Monitor and report > SOAR reports > Use Looker Explores in SOAR reports (Advanced Reports)
Google Cloud Documentation: Google Security Operations > Documentation > Monitor and report > SOAR reports > Explore SOAR reports
60 questions covering all exam domains, starting from $20
Exam domains verified against: Official Google Security-Operations-Engineer exam guide, last checked September 2026.
Configure detection and response tools like Security Command Center and Google Security Operations. Set up user and service account authentication, authorization using IAM roles, API access for automations, and audit log analysis.
Ingest logs into security tools by determining data ingestion approaches and configuring parsers. Build a baseline of user, asset and entity context by identifying threat intelligence and enriching event data with contextual information.
Sample question from this domain above: Q4
Develop queries to find anomalous activity across logs and analyze user behavior. Search for indicators of compromise using threat intelligence feeds, historical logs and newly enriched data to identify emerging attack patterns.
Design detection rules that identify threats by reconciling threat intelligence with user and asset activity. Build rules using risk values, entity data and custom detectors to discover anomalous behavior and posture changes.
Collect forensic evidence and analyze incident scope using security tooling. Build and implement response playbooks with automations and orchestrations to contain incidents and manage cases through investigation and remediation.
Create dashboards and reports that visualize security telemetry, detections, and alerts. Configure health monitoring and alerting with thresholds for key metrics using Google Cloud tools and notification systems.
Common questions about the exam itself

